We did – in our paper titled “Beyond rankings: comparing directed acyclic graphs” (pdf) which I’ll be presenting at the ECML PKDD conference in Portugal next month. This was the first project of my PhD, but there’s also something else that makes it fundamentally different from the other research projects I’ve been involved with.
Typically, when I undertake a research project, I have a concrete question, like what is the next location a person will visit, to which I start looking for different solutions. In other words, I begin with a nail and start looking for a suitable hammer. However, this time we started by developing a cool new hammer with some neat theoretical properties before we had any idea if a suitable nail even exists.
Going back a few hundred years
Before I explain what are DAGs and what we actually did in our paper, let me briefly take you to the 18th century. Back in those days, a guy called Jean-Charles de Borda and a few other Frenchmen were debating, what is a good election system. In 1781 Borda, who was a mathematician and a political scientist, published a method which is today known as the Borda count. This method asks the voters to rank all candidates and then aggregates the rankings of the individual voters by giving n points to the first candidate, n-1 to the second, and so on, where n is the number of candidates, and finally sums up the points of different voters.
Since then, numerous other methods for aggregating rankings fairly and computationally efficiently have been developed and it is still an active area of research. These methods have also seen several new applications that Borda and the other early innovators hardly had in mind when they did their research. For example, in the case of web search they’re used for meta search engines which aggregate the rankings of individual search engines like Google and Bing.
Our contribution
We took the rank aggregation problem one step further and asked ourselves, what if the objects we want to aggregate are not rankings but something more complex, namely directed acyclic graphs (DAGs). If you take, say, all Twitter users and draw an edge (= a link) from each follower to the followee, you’ll get a directed graph. A DAG is a directed graph which doesn’t contain any directed cycles. Ranking list is a special case of a DAG. We formalized and addressed the following three questions related to DAGs
- How to compute a distance/similarity between two DAGs?
- How to aggregate DAGs? In other words, how to find a centroid DAG which is as similar to the input DAGs as possible?
- How to cluster DAGs? That is, how to find a grouping of input DAGs so that the DAGs within the same group are as similar as possible?
We showed that the second and the third question are computationally very hard (NP-hard to be precise) and introduced a couple of efficient algorithms which give approximate solutions to these problems.
Where’s the nail?
Once we had the math worked out, we started thinking, where can we use it. After all, if you have a good application for your new method, it’s much easier to sell it to the research community. Pretty quickly, we came up with two problems which seem quite different at first glance but both of which can be presented under the DAG framework.
The first application is inspired by the rank aggregation problem encountered in election systems. It is a rather strong assumption that a user has provided ranking over all options to be ranked, since in many cases we only know a set of pairwise preferences which do not necessarily cover all options. These pairwise preferences can be represented as a DAG, after which we can aggregate and cluster preference DAGs of different users using the methods we introduced.
We set up a small survey on a Finnish lyrics website, asking the visitors to answer 10 questions of the form “Which artist do you like more: A or B” where A and B were two randomly selected music artists from a set of twenty Finnish/international artists. We collected 960 replies and clustered the preference graphs of these users to discover listener groups with distinct preferences. The results with the most preferred artists on the top are shown below.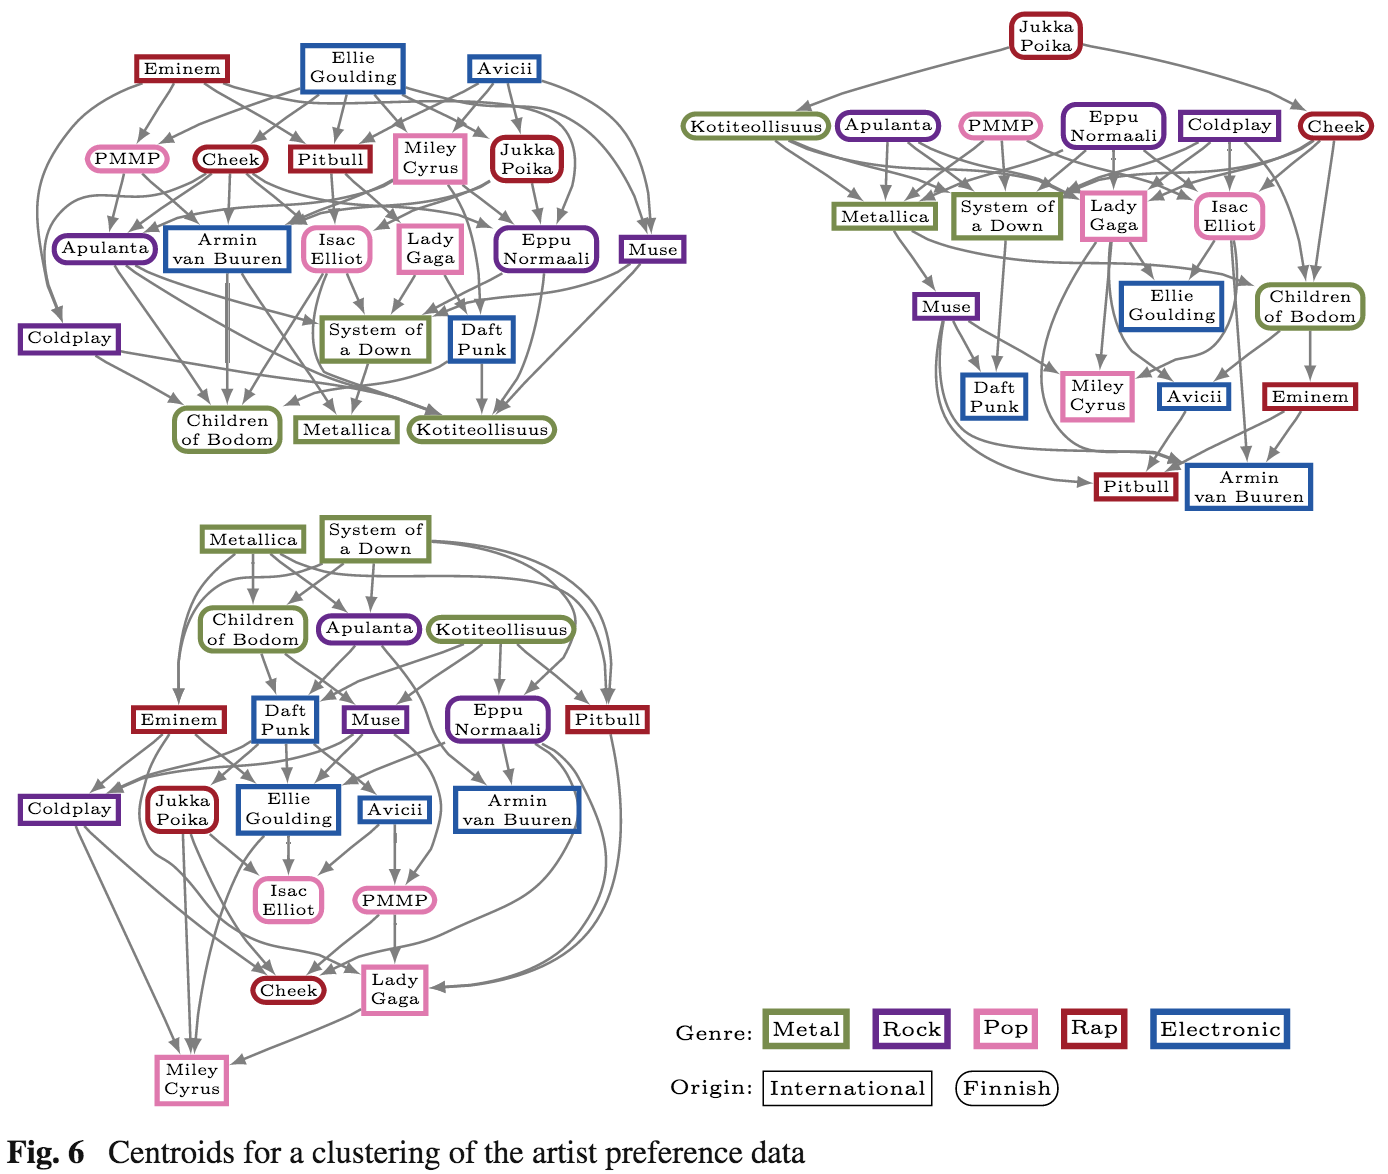 Mostly the results were in line with what you could have expected. There is a group of listeners who prefer anything but metal (top-left), whereas the group on the bottom captures all the metalheads. The third group, however, revealed something quite interesting we couldn’t have easily predicted before seeing the results: there is one group of people for whom the genre doesn’t seem to play a role but who prefer Finnish artists over the international ones.
Our second application is related to information cascades. When you discover an interesting link on Facebook and you like it or share it, it will be shown to your friends, after which some of them might endorse the link, and this information starts to propagate trough the social network. When person X likes a link, you can draw an edge to X from all of X’s friends, who have liked it before, and what you get is – you guessed it – a DAG, representing a potential information cascade. We did such an analysis with music listening data from Last.fm and showed that also information cascades can be efficiently analyzed using the proposed framework. This type of analyses could help us identify, for example, influential persons in a network.
Final thoughts
In the beginning, I had some doubts about our “let’s first come up with a fancy method and then think about where to apply it” approach. After all, there’s the saying that “if all you have is a hammer, everything looks like a nail”. But once we got the results with the music preference data, I got convinced that it was indeed a good idea. And you never know what useful applications other people might come up with later.
In a broader perspective, I think our project illustrates the importance of basic research. The following tweet says it even better:
Another thing that became clearer to me during this project was that theoretical method development can be quite frustrating at times. For instance, when trying to complete a proof, you might be banging your head against a wall for a long time without making any progress at all. But when you finally nail that proof, the feeling is amazing!
By contrast, if you start with a dataset and a well-defined problem, you can almost always solve it one way or another. But you may end up discovering that the best solution is to use a well-known standard method. If you’re working for a company, that’s fine, but if you need to publish, it may be problematic, since applying an existing method to a new dataset doesn’t often make a strong scientific contribution.
Finally, nowadays when I hear the following song, it always makes me think of directed acyclic graphs. Having made it to the end, I hope this applies to you as well!
(Thanks to Nikolaj for coming up with the title of this post while we were brainstorming for the title of the paper.)

Reblogged this on Northern Bytes.
LikeLike
^^ You should watch this video.
LikeLike