We did – in our paper titled “Beyond rankings: comparing directed acyclic graphs” (pdf) which I’ll be presenting at the ECML PKDD conference in Portugal next month. This was the first project of my PhD, but there’s also something else that makes it fundamentally different from the other research projects I’ve been involved with.
Typically, when I undertake a research project, I have a concrete question, like what is the next location a person will visit, to which I start looking for different solutions. In other words, I begin with a nail and start looking for a suitable hammer. However, this time we started by developing a cool new hammer with some neat theoretical properties before we had any idea if a suitable nail even exists. Continue reading →
Every now and then I’ve thought about starting my own blog but only recently, when an idea of a blog focused entirely on data science issues crossed my mind, I really got excited about it as I could easily think of several projects I would want to tell others about. It also seemed like a natural timing as I officially started my doctoral studies last Thursday.
I have to admit that I’m quite lazy to follow other people’s blogs but, fortunately, I’ve decided to make this blog such that even I myself could imagine following it! 😉 This in mind, I’ve set myself three goals regarding what I should publish:
Write only about cool things (as judged by me)
Try to include at least one picture per post
Write (mainly) popular science so that you don’t have to have a degree in computer science to get the main message in each post (please, let me know if I’m failing at this)
The first criterion should be relatively easy to meet as I’ve had an opportunity to work on many projects in my studies, work and free time that I think are really exciting!
What is Data Science?
At this point, you might be wondering, what is data science, anyways? Well, for starters it’s a buzzword somehow related to the fact that the amount of publicly available data has exploded and people have started realizing its potential to transform our society. This has led some people to talk about data as the “new oil”.
But to be more precise, I think Wikipedia gives a rather nice description:
Data science is the study of the generalizable extraction of knowledge from data.
So basically, we are trying to find meaningful patterns among a bunch of 0s and 1s. One could even say: we are Mining for Meaning from seemingly messy data. Term data science spans over several different disciplines, including data mining, machine learning, statistics, visualization, etc., and this actually suits me well as it provides nice flexibility when thinking about what posts would be relevant for this blog.
Case: Mining for Art
Let’s finally get our hands dirty. In this first post, we’re actually not going to analyze any data (except for some self-generated one) but we’ll rather take a look at two fundamental graph search algorithms, namely the breadth-first search (BFS) and the depth-first search (DFS).
I learned these algorithms back in high school where I was taught that I could solve a maze using either of these algorithms (there are, of course, many other applications as well). The BFS would go through the maze by extending the search uniformly in all directions, while the DFS would proceed along one path as long as it could until it found the exit or hit a dead-end, after which it would backtrack to the previous intersection and continue.
I wasn’t so much into maze solving so I started thinking what else could I do with these algorithms. One idea occurred to me – I could view an image as a graph where each pixel corresponds to a node and each node is linked to its neighboring pixels. Then I could try to color the picture pixel-by-pixel, using one of the two algorithms, not actually to search for anything but simply to go through the whole image. The idea was that when we first visit a pixel, we color it by calculating the average color of the neighboring pixels that have already been colored and by adding a small deviation to the average.
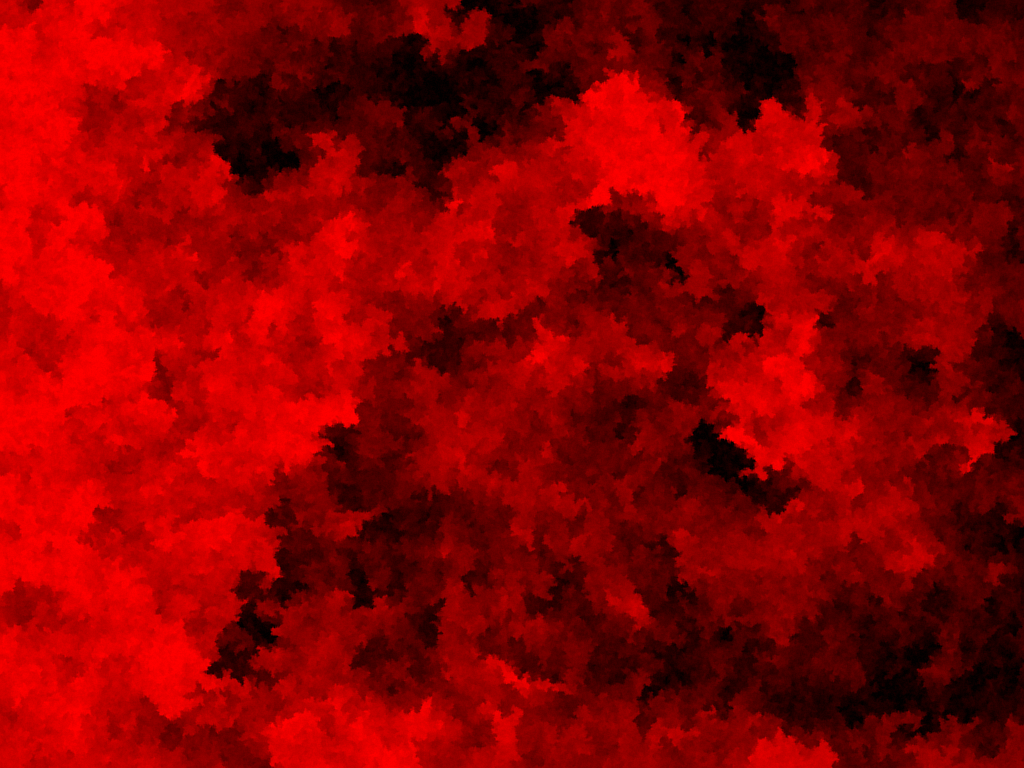
Using such a simple algorithm, I was pretty awestruck when I first ran the algorithm and the output was something like this:
A picture randomly drawn by the BFS algorithm.
A picture randomly drawn by the DFS algorithm.
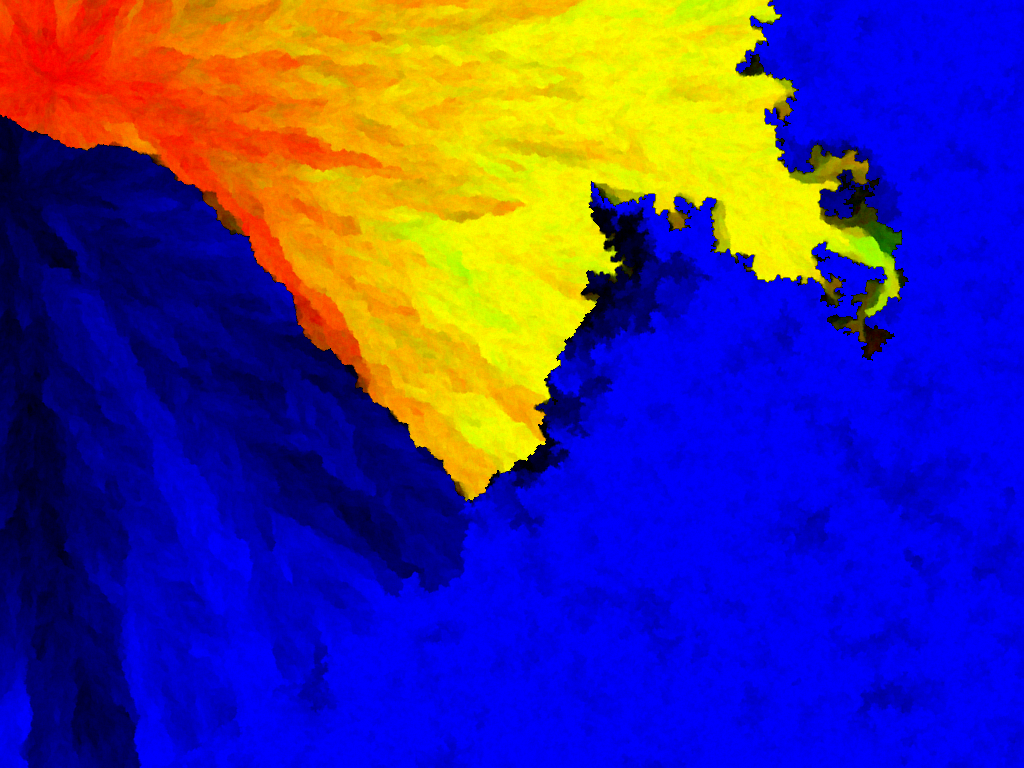
Then I modified the picture generating program so that it supports running several instances of BFS and DFS searches simultaneously with different parameters in order to get more diverse pictures. Here are two examples of what I got:
Mix of BFS and DFS searches.
“Sunset over blue mountains”
Finally, during the first year of my university studies, I put together a simple software that allows me to draw these pictures more interactively. Here’s a link to a video of that software animating the formation of a picture:
To wrap it up: a system with very simple rules can exhibit surprisingly interesting behavior!